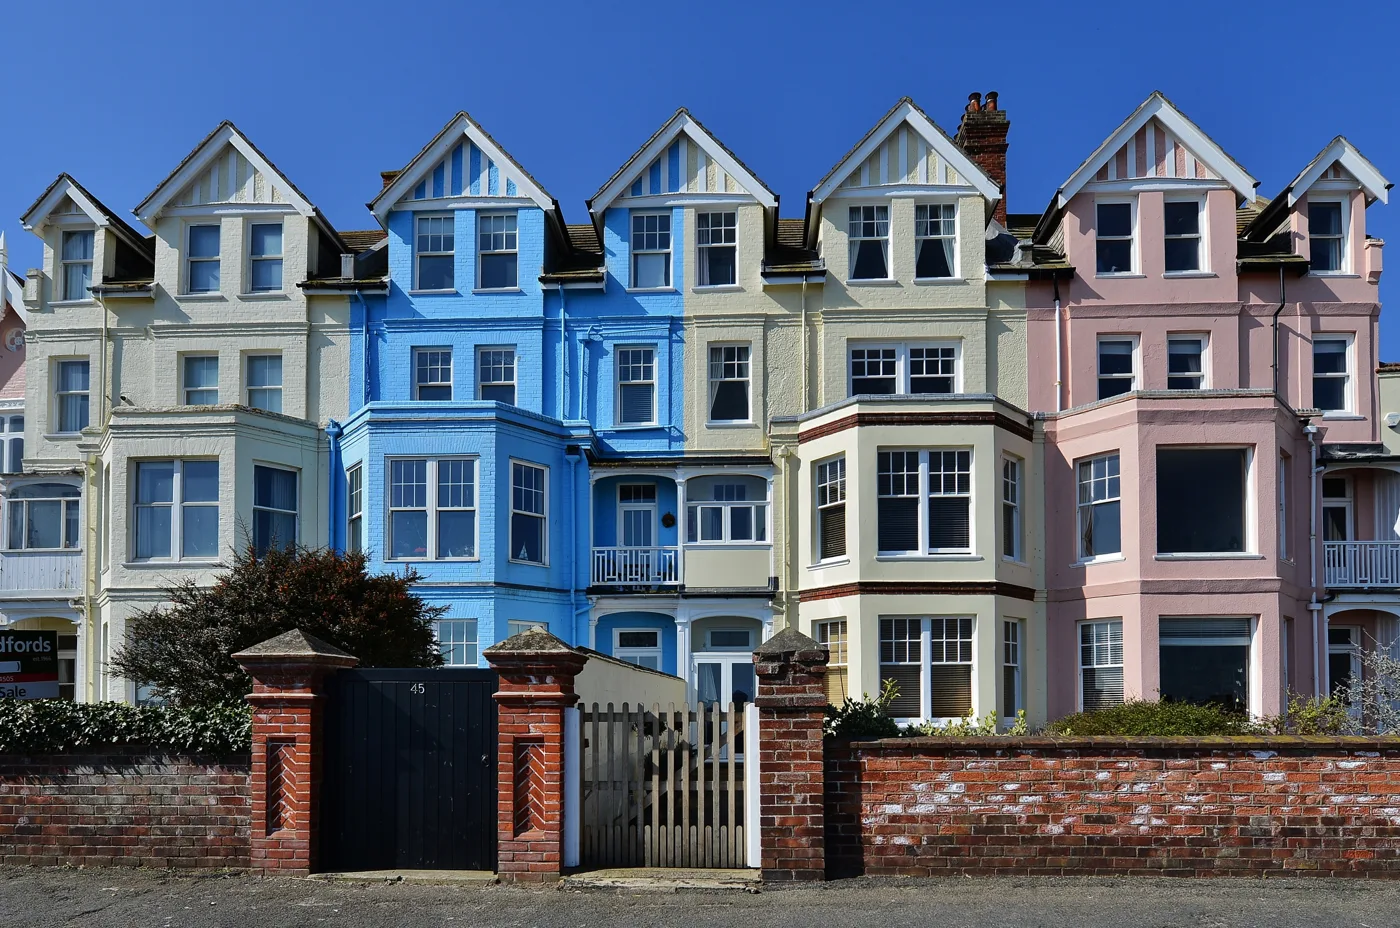

East Suffolk homes lost £2,883 in a year, to £276,301: the only fall of Suffolk's five districts. Flats are down 4.1% and sales are at a 2020 low.
The average home in East Suffolk was worth £276,301 in July, £2,883 less than a year earlier. That is a fall of 1.0%, and it makes East Suffolk the only one of Suffolk’s five districts where prices went backwards over the year. (UK House Price Index, East Suffolk)
Everywhere else in the county went up. Mid Suffolk, which starts a few miles inland of Woodbridge, rose 3.2%. The figures were published by HM Land Registry at 9.30am on 16 September and cover sales completed in July.
It is the fourth month in a row that the district average has fallen, and the first time since March that the annual figure has turned negative.
How East Suffolk compares with the rest of the county
The county splits cleanly. The four districts that rose were:
- Mid Suffolk, up 3.2% to £315,898
- Ipswich, up 1.3% to £221,445
- Babergh, up 0.7% to £330,523
- West Suffolk, up 0.3% to £294,810
East Suffolk fell 1.0% to £276,301. Suffolk as a whole managed +0.5%, and England +1.1%. (UK House Price Index, HM Land Registry)
Two things are worth saying plainly about that number. The UKHPI average is a mean, not a median, so a handful of expensive sales pull it about. And East Suffolk is not just this coast: the district runs from Felixstowe to Lowestoft and the Norfolk border, so the figure covers two housing markets that behave very differently.
The pattern is coastal, not just Suffolk
We checked all 44 local authority areas in the East of England for the same month. Eleven of them saw prices fall over the year, and East Suffolk was the eighth weakest.
What the bottom of that table has in common is the sea. Four of the eight weakest areas are coastal districts:
- Castle Point, down 4.3%, on the Essex side of the Thames estuary
- North Norfolk, down 3.1%
- Tendring, down 1.4%, which covers Clacton and Harwich
- East Suffolk, down 1.0%
The rest of the bottom eight are Brentwood, Chelmsford, Norwich and Epping Forest. Every figure here comes from the same Land Registry release, area by area.
Flats are taking it hardest
Within East Suffolk, the fall is not spread evenly. Broken down by type, the year to July looks like this:
| Type | Average price | Change on the year |
|---|---|---|
| Detached | £402,375 | -1.3% |
| Semi-detached | £263,738 | -0.3% |
| Terraced | £204,570 | -0.7% |
| Flat or maisonette | £139,283 | -4.1% |
| First-time buyer | £225,708 | -0.7% |
Flats fell four times as fast as anything else. The 4.1% drop is steeper than the England-wide fall in flat prices of 3.5%. And at £139,283, the average East Suffolk flat is worth almost exactly what it was in May 2018, when the same index put it at £139,233. That is an eight-year round trip to nowhere.
That matters more here than the headline number does. Flats are what first-time buyers and downsizers actually buy in Felixstowe, Lowestoft and Aldeburgh, and they are what most of the district’s new-build schemes deliver.
The number nobody reports: how few homes are changing hands
Prices are only half the index. Land Registry also counts completed sales, and that side of it is starker.
1,148 homes were sold in East Suffolk between January and May 2026. That is down from 1,629 in the same five months of 2025, a drop of nearly 30%.
It is also, in a record that runs back to 1995, exactly level with 2020, when the housing market was legally shut for two of those five months. Only three years in the whole series were lower: 2009 (994), 2011 (1,123) and 2010 (1,143).
Land Registry publishes sales counts two months behind the price index and revises them upward as registrations catch up, so the 2026 total will probably rise a little. It would have to rise by a fifth to reach last year’s level.
A correction to our June figure
When we reported the June index on 19 August we gave the East Suffolk average as £278,376, up 1.2% on the year. Land Registry has since revised that month down to £277,168, up 0.7%. The October 2025 peak has also been revised, from £285,597 to £284,919.
Revisions like this are normal: the index is recalculated each month as more completed sales are registered. On the revised numbers, a typical East Suffolk home is now £8,618 below its October 2025 peak.
What it means for you
If you are selling, the district average has now fallen for four months running and the buyer pool is the thinnest it has been outside 2020. The gap with Mid Suffolk, a few miles inland, is 4.2 percentage points in a single year.
If you are buying, the one part of the market that has moved decisively in your favour is flats, down 4.1% on the year and 13.6% below their January 2023 level, which is the index’s base month.
If you are neither, the figure still reaches you. Council tax bands are set from 1991 values and do not move with the index, so a falling average does not cut your bill: how East Suffolk council tax bands work. What it does change is the stamp duty and the deposit a local buyer needs.
We publish the district figure every month it is released, alongside the longer-run local picture on our Woodbridge house prices page.
Sources
- UK House Price Index, East Suffolk, July 2026, HM Land Registry
- UK House Price Index reports, gov.uk, for the release date and the mean-average methodology
- District and regional comparisons taken from the same index, area by area, at landregistry.data.gov.uk/app/ukhpi
Have your say